Das Dashboard
The Dashboard
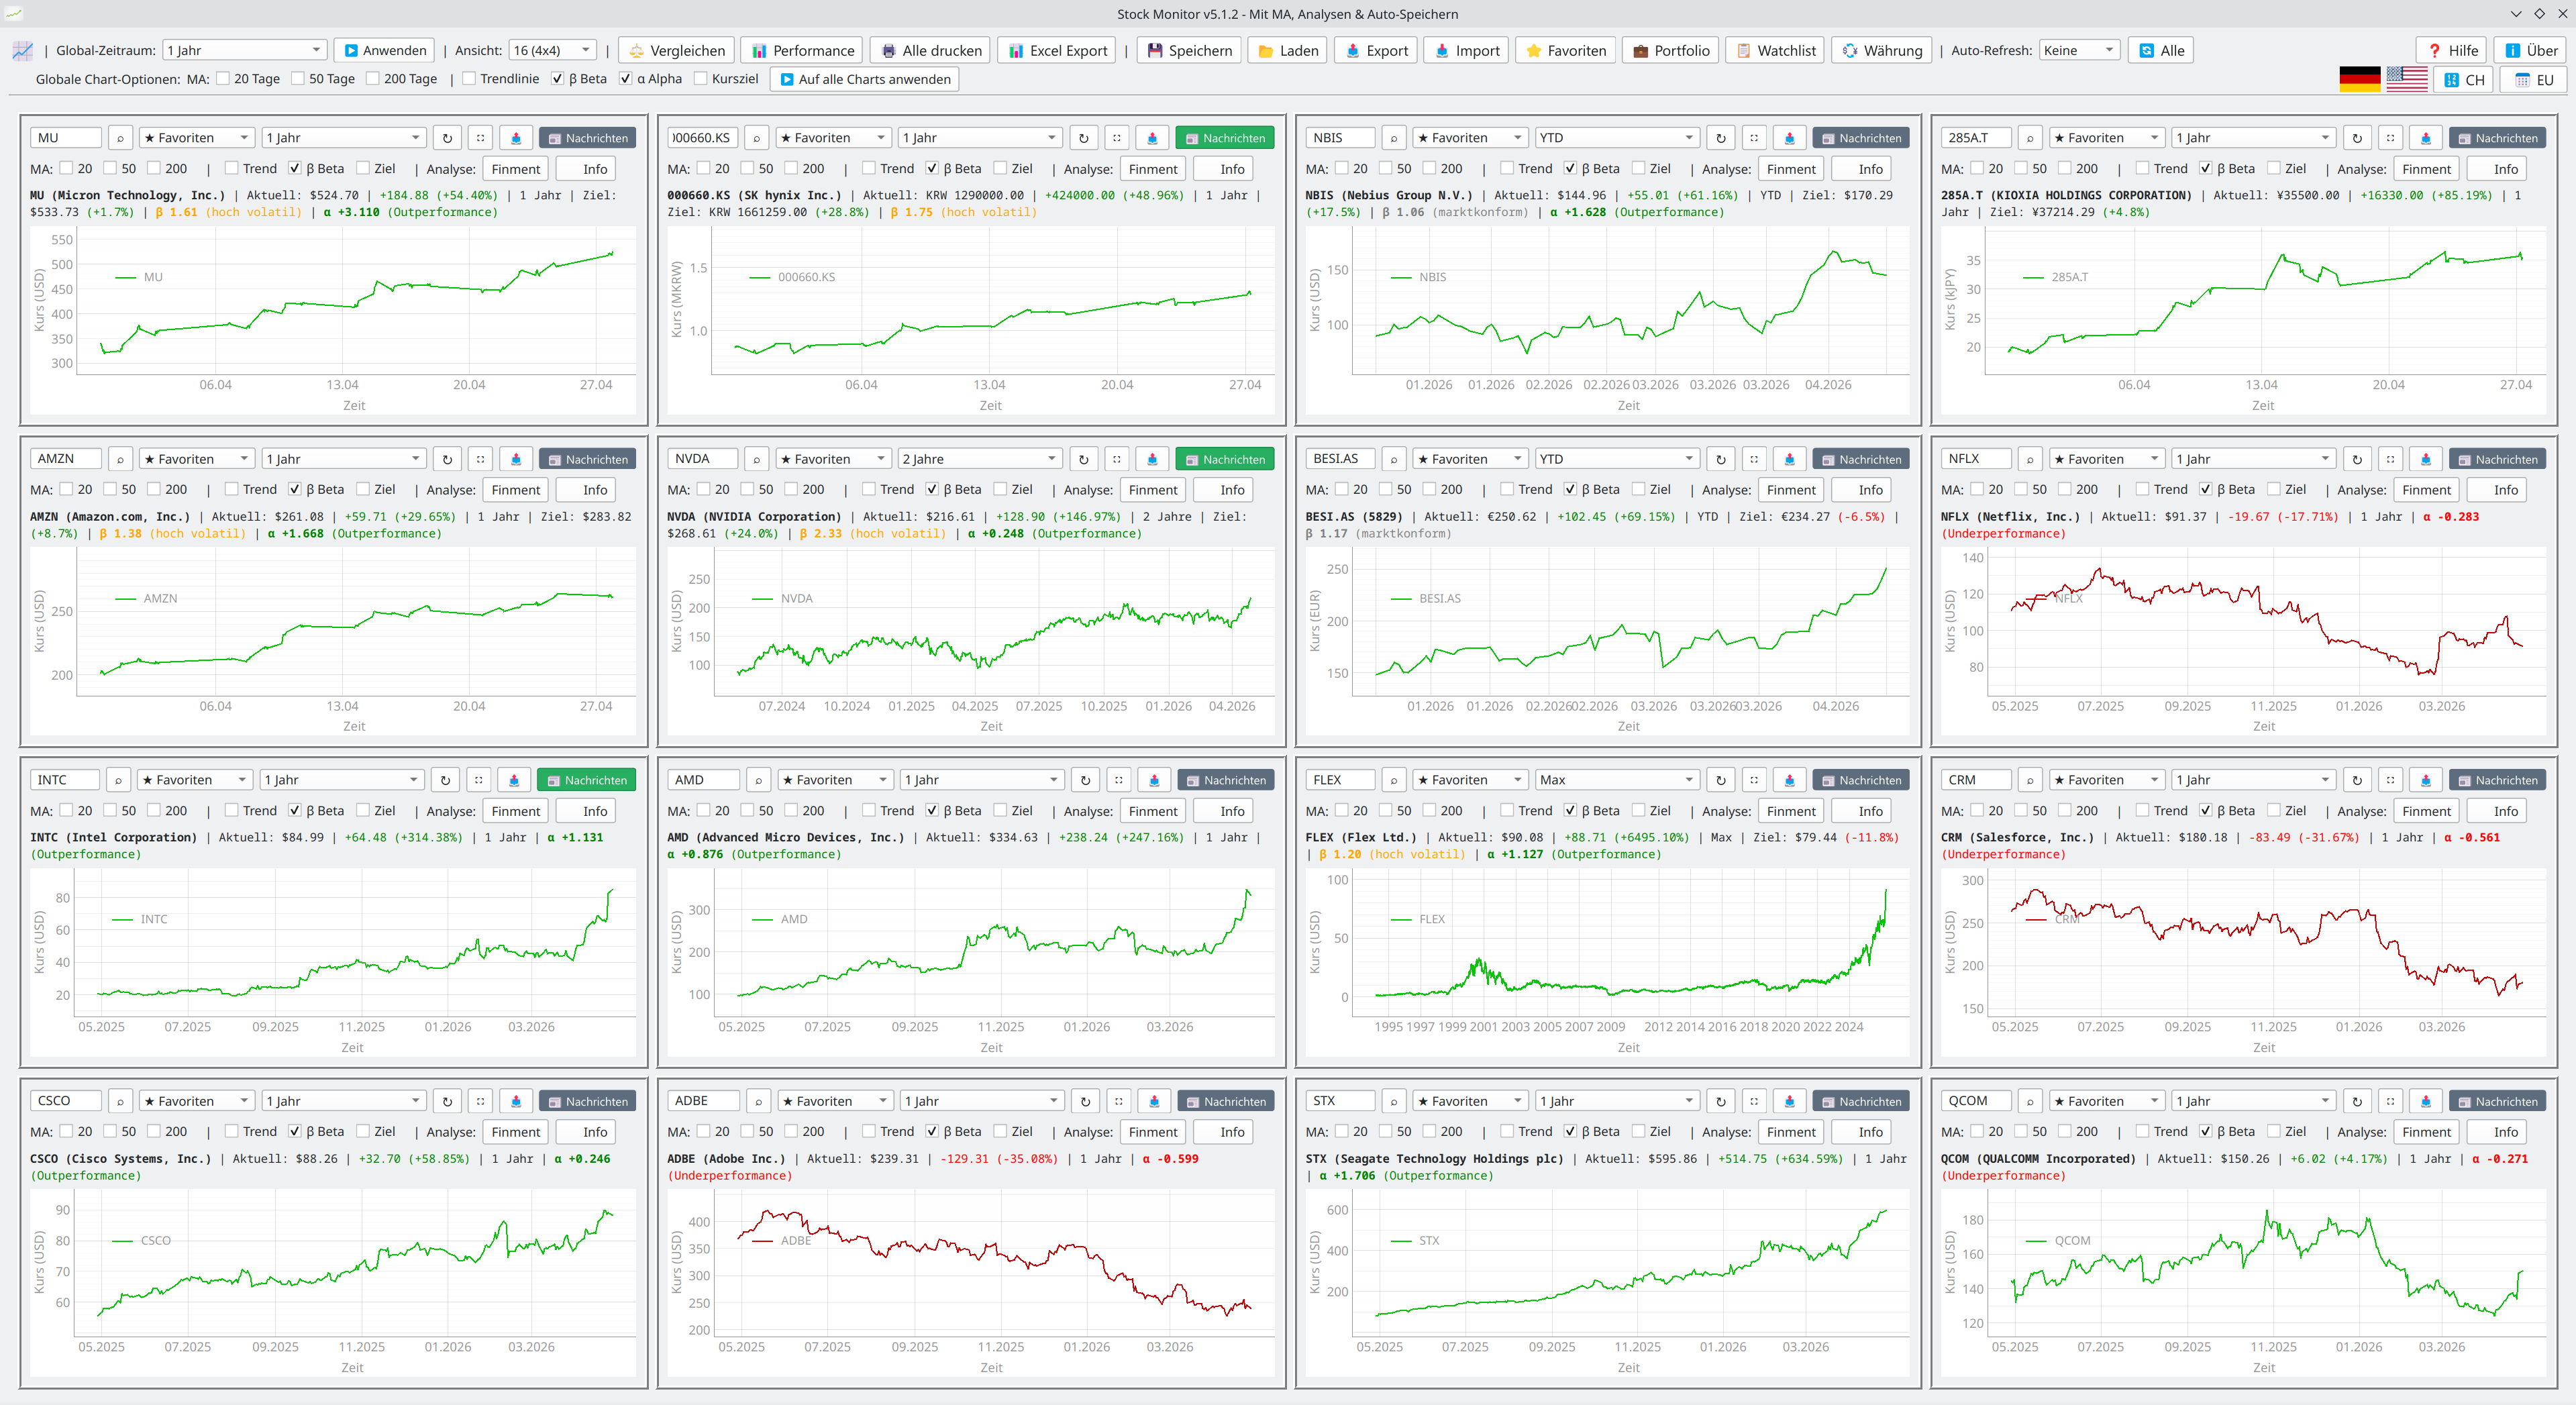
Bis zu 16 Charts auf einen Blick
Up to 16 Charts at a Glance
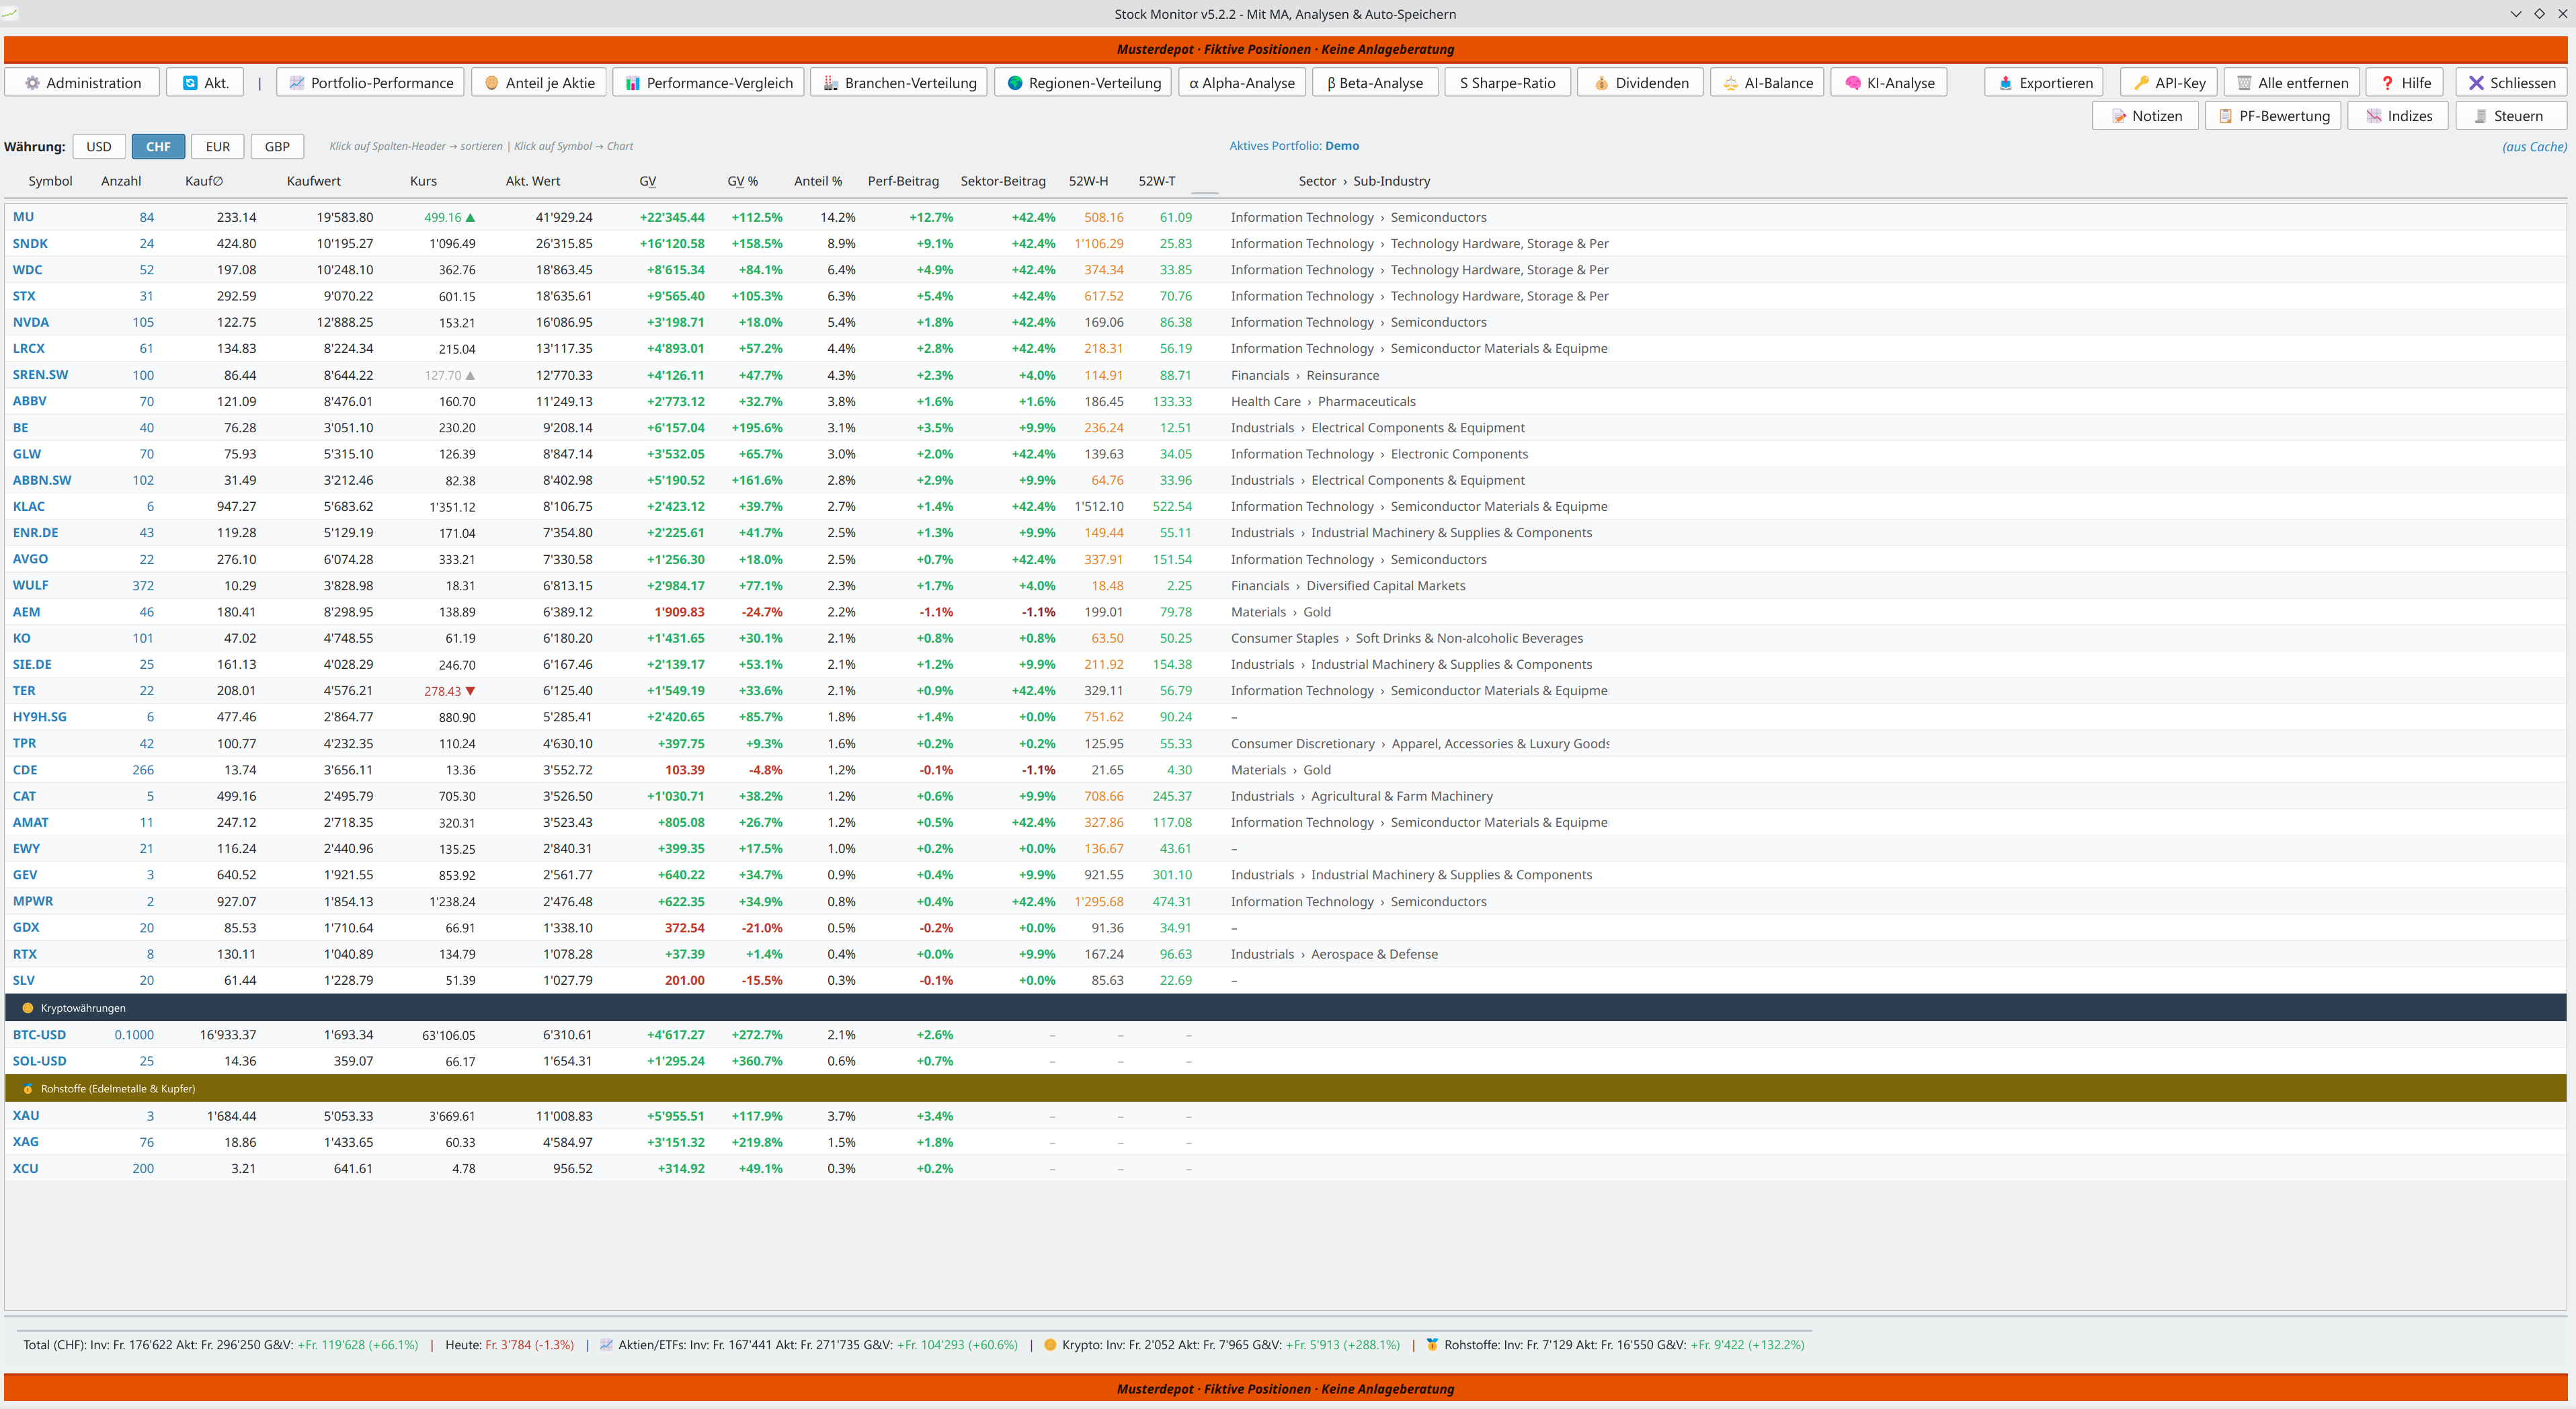
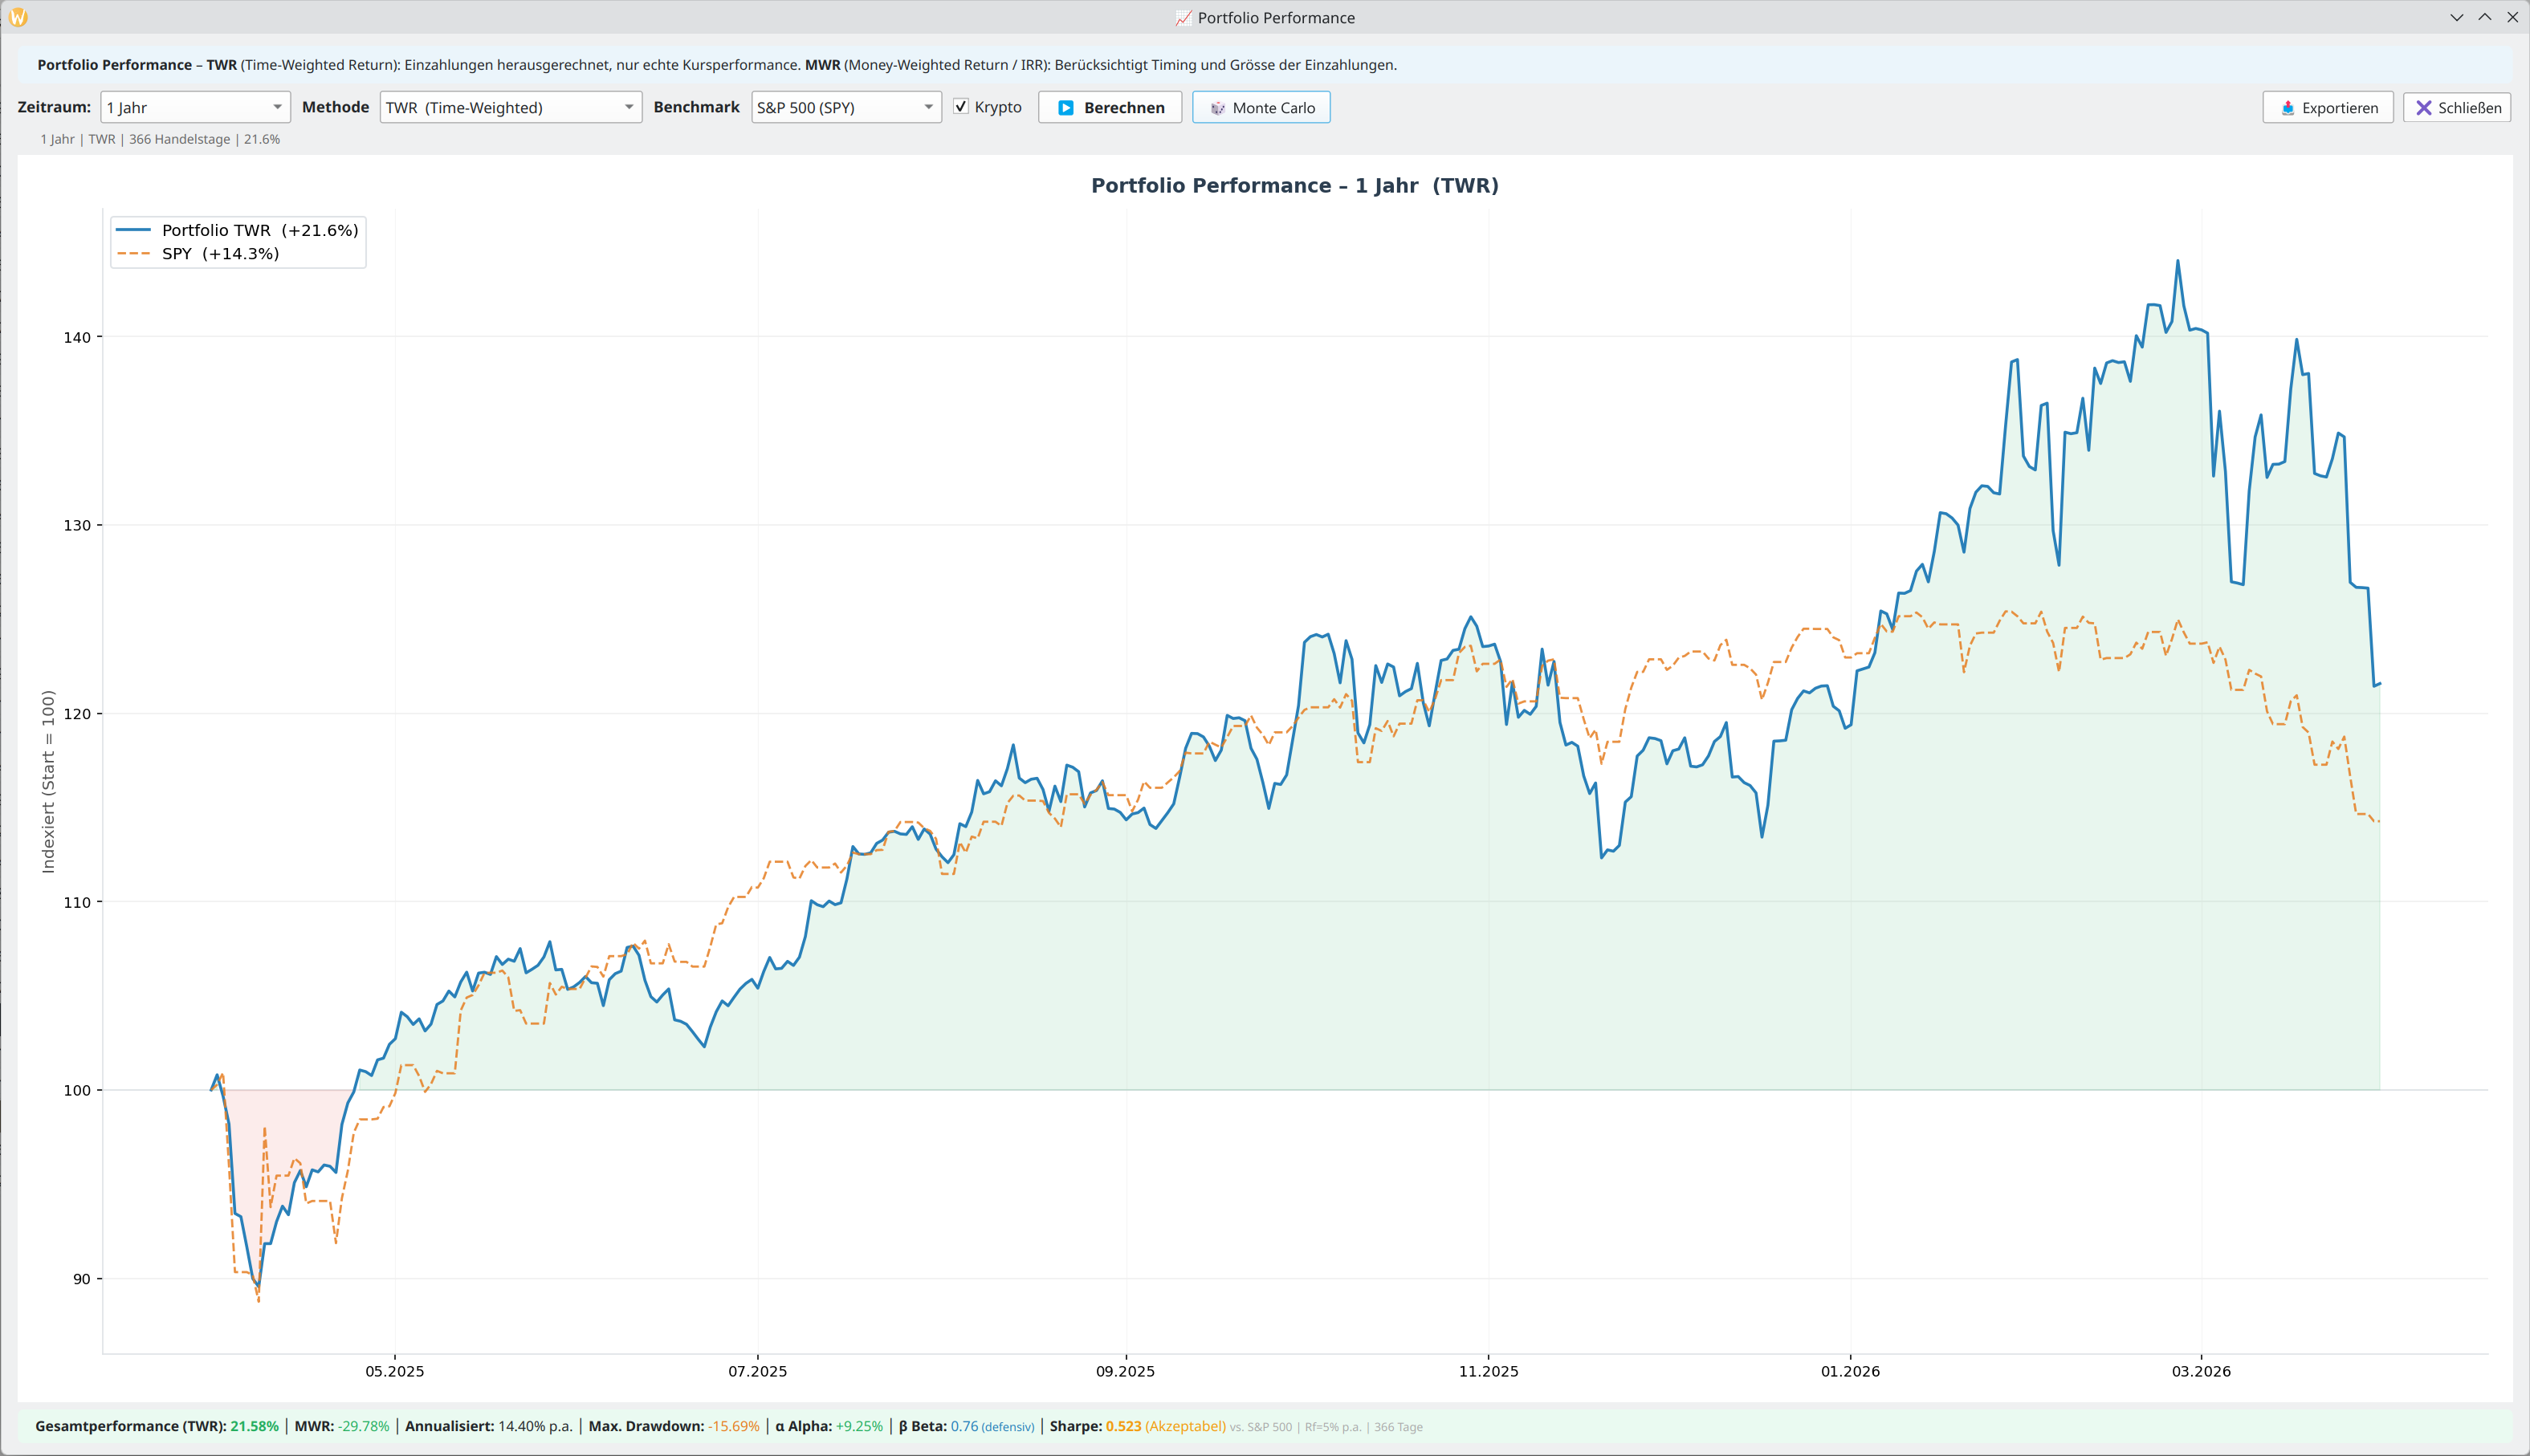
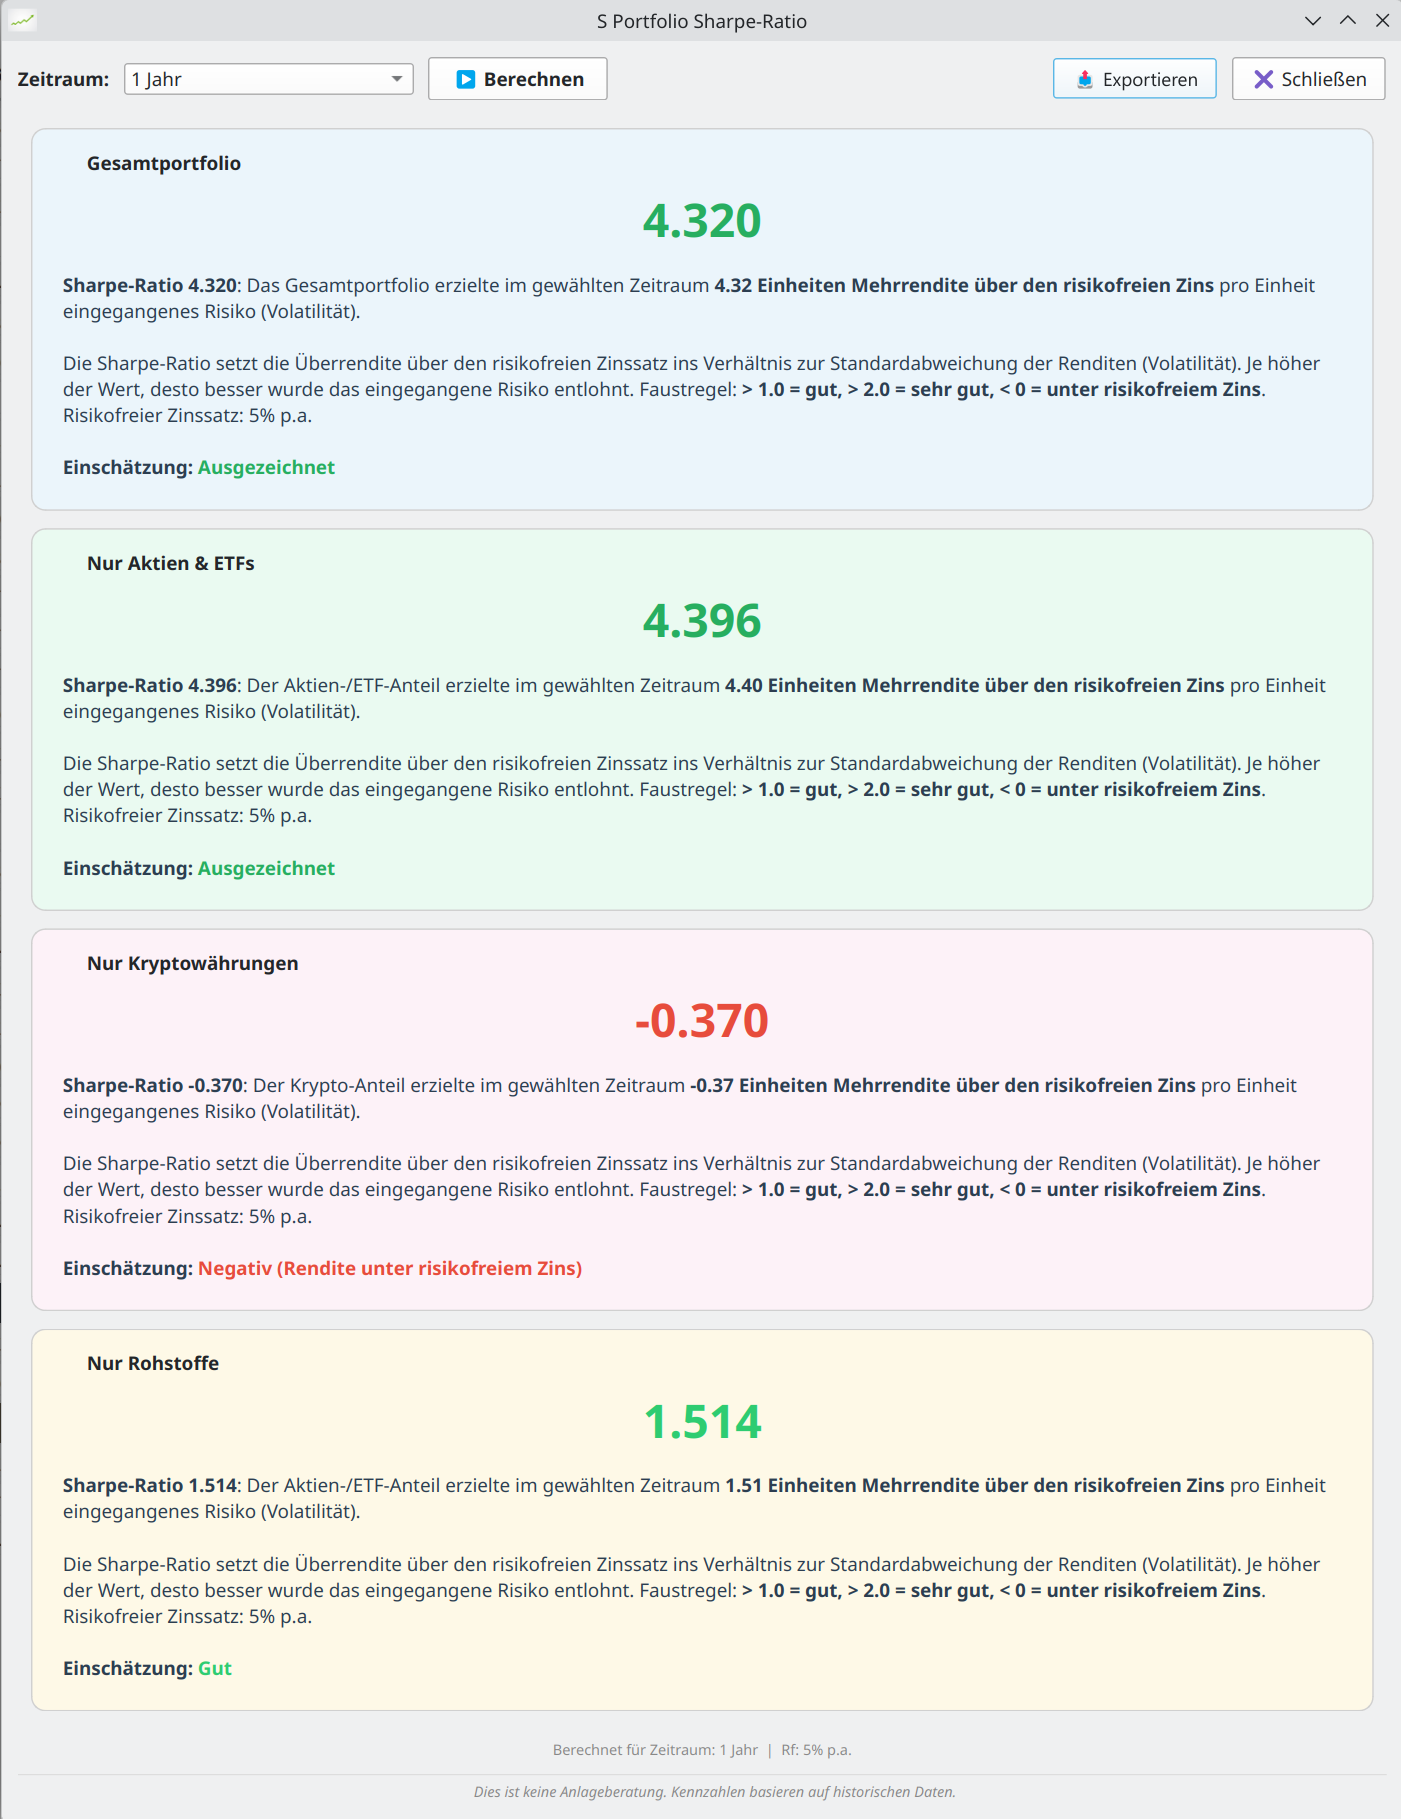
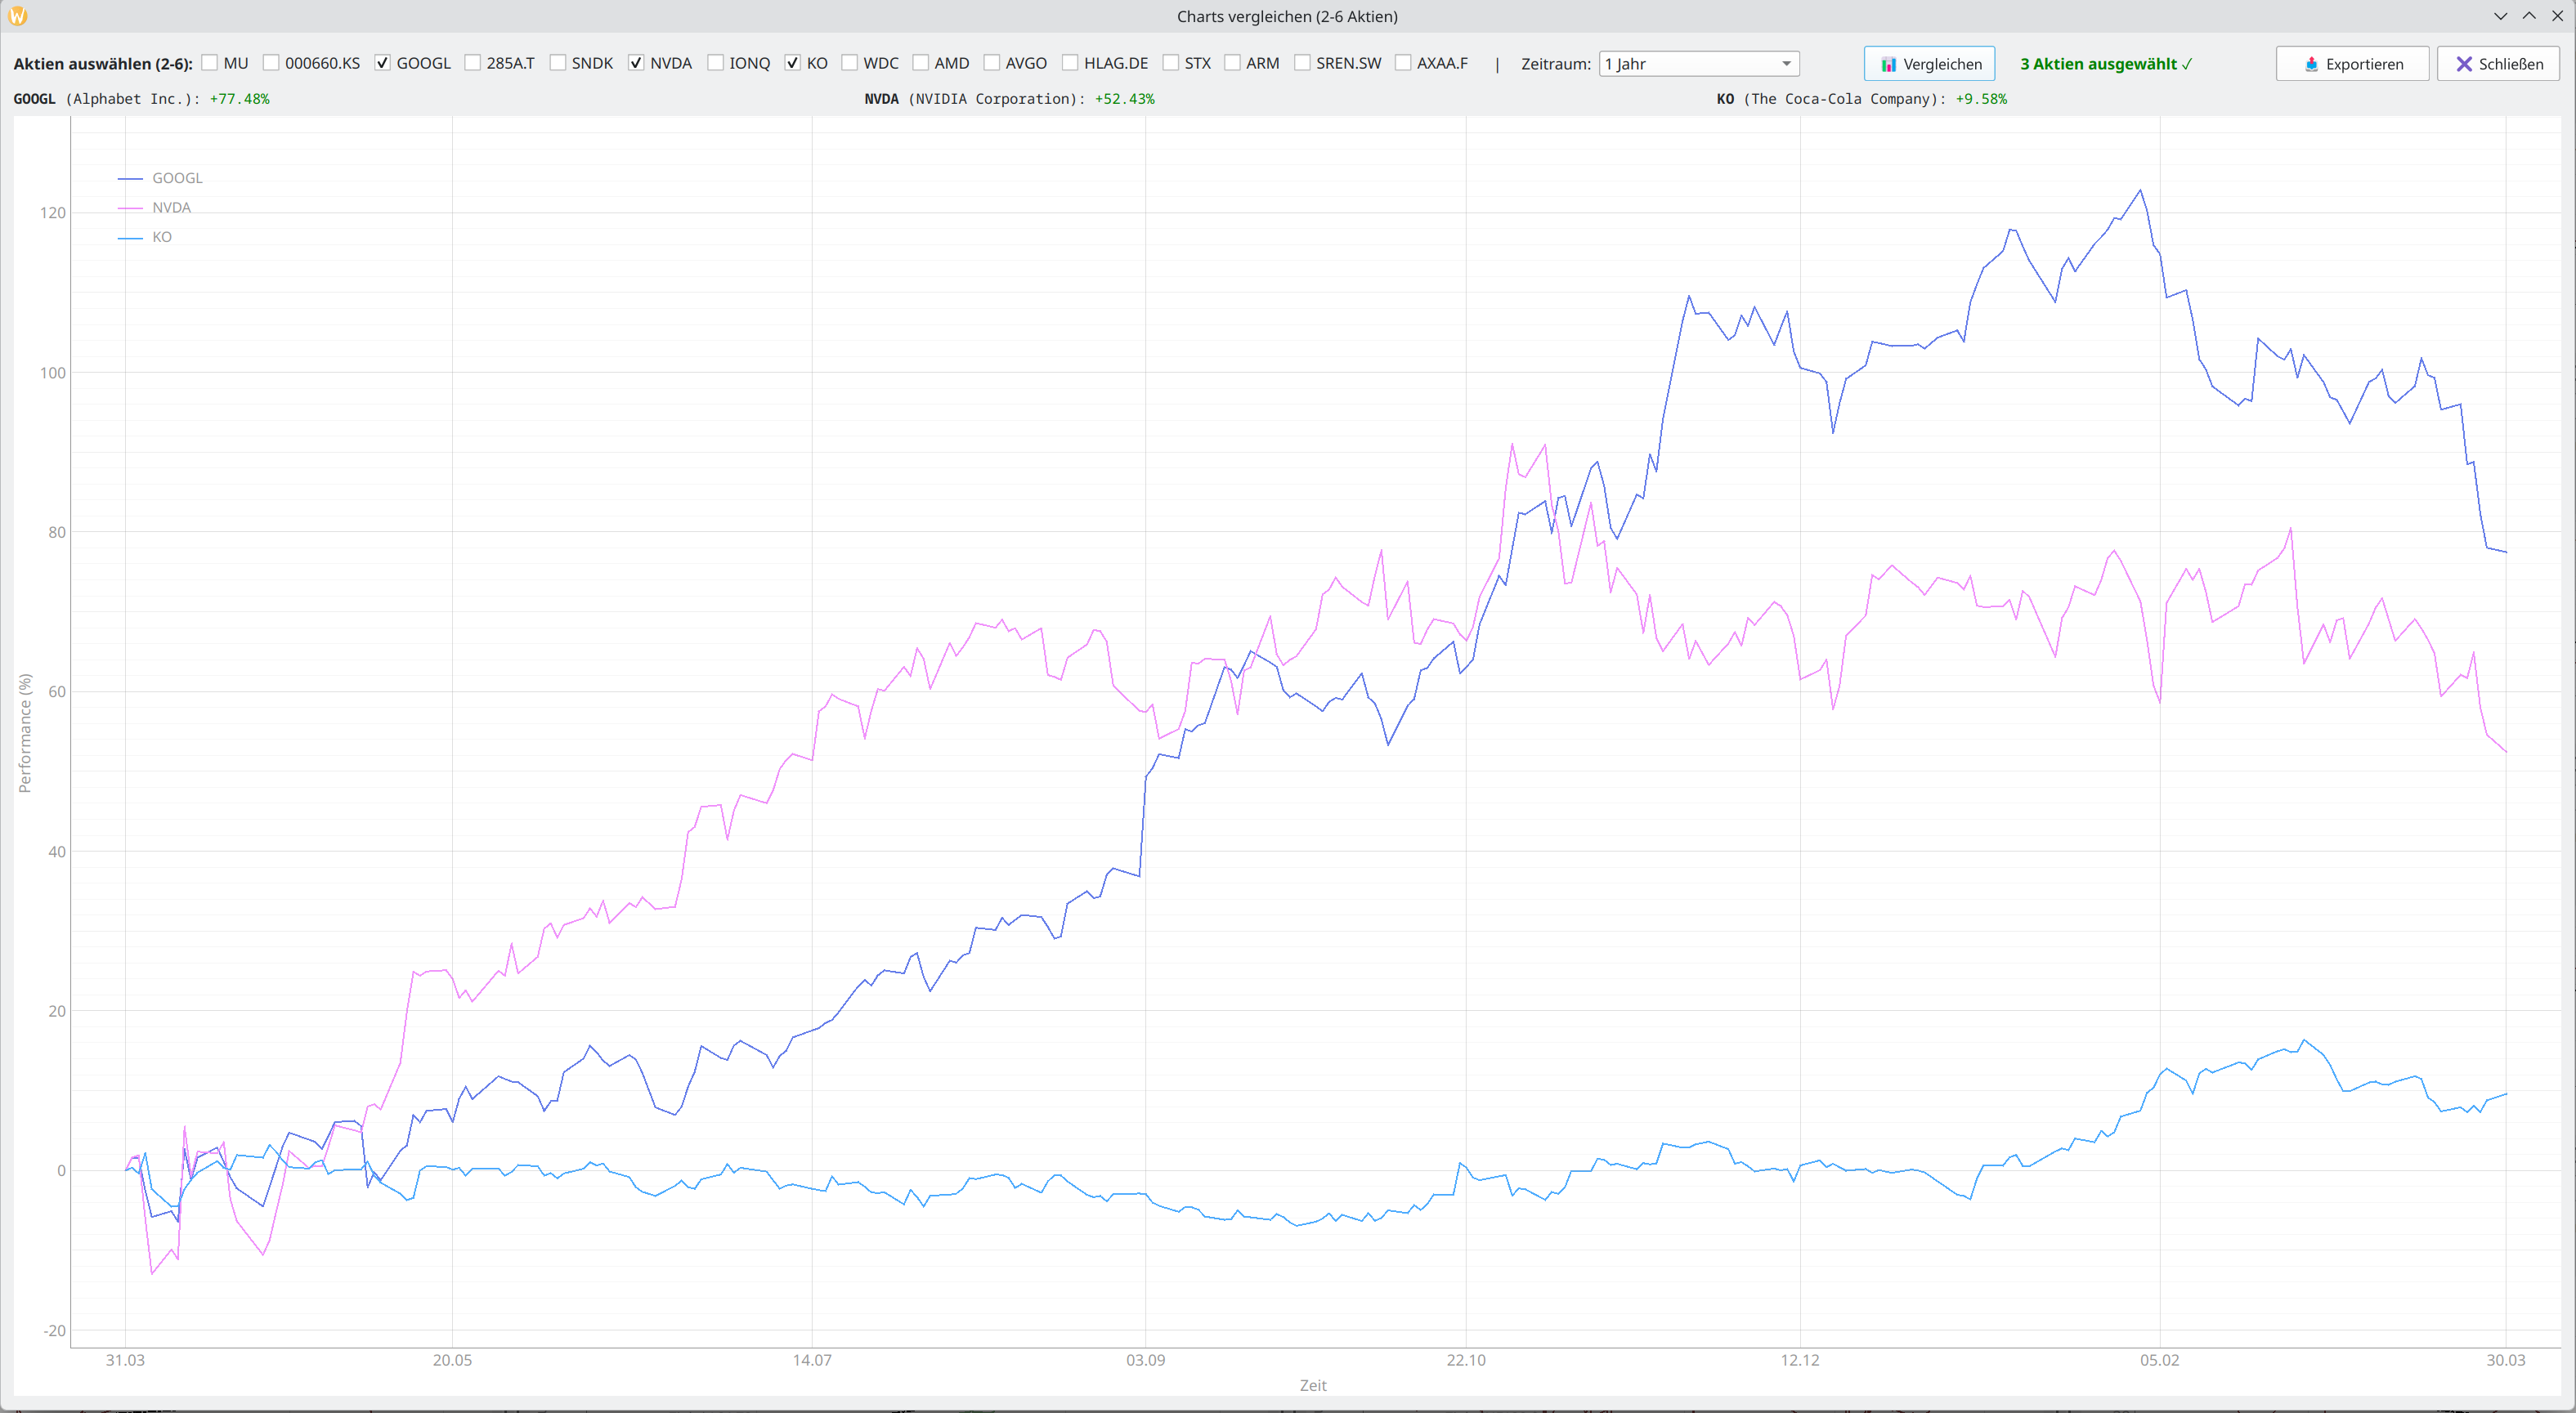
Behalte alle deine Positionen simultan im Überblick — mit Moving Averages, Trendlinien, RSI, Bollinger Bands, Beta, Alpha und Sharpe Ratio. Zoom in jeden Chart für Detailanalysen.
Monitor all your positions simultaneously — with Moving Averages, trend lines, RSI, Bollinger Bands, Beta, Alpha and Sharpe Ratio. Zoom into any chart for detailed analysis.
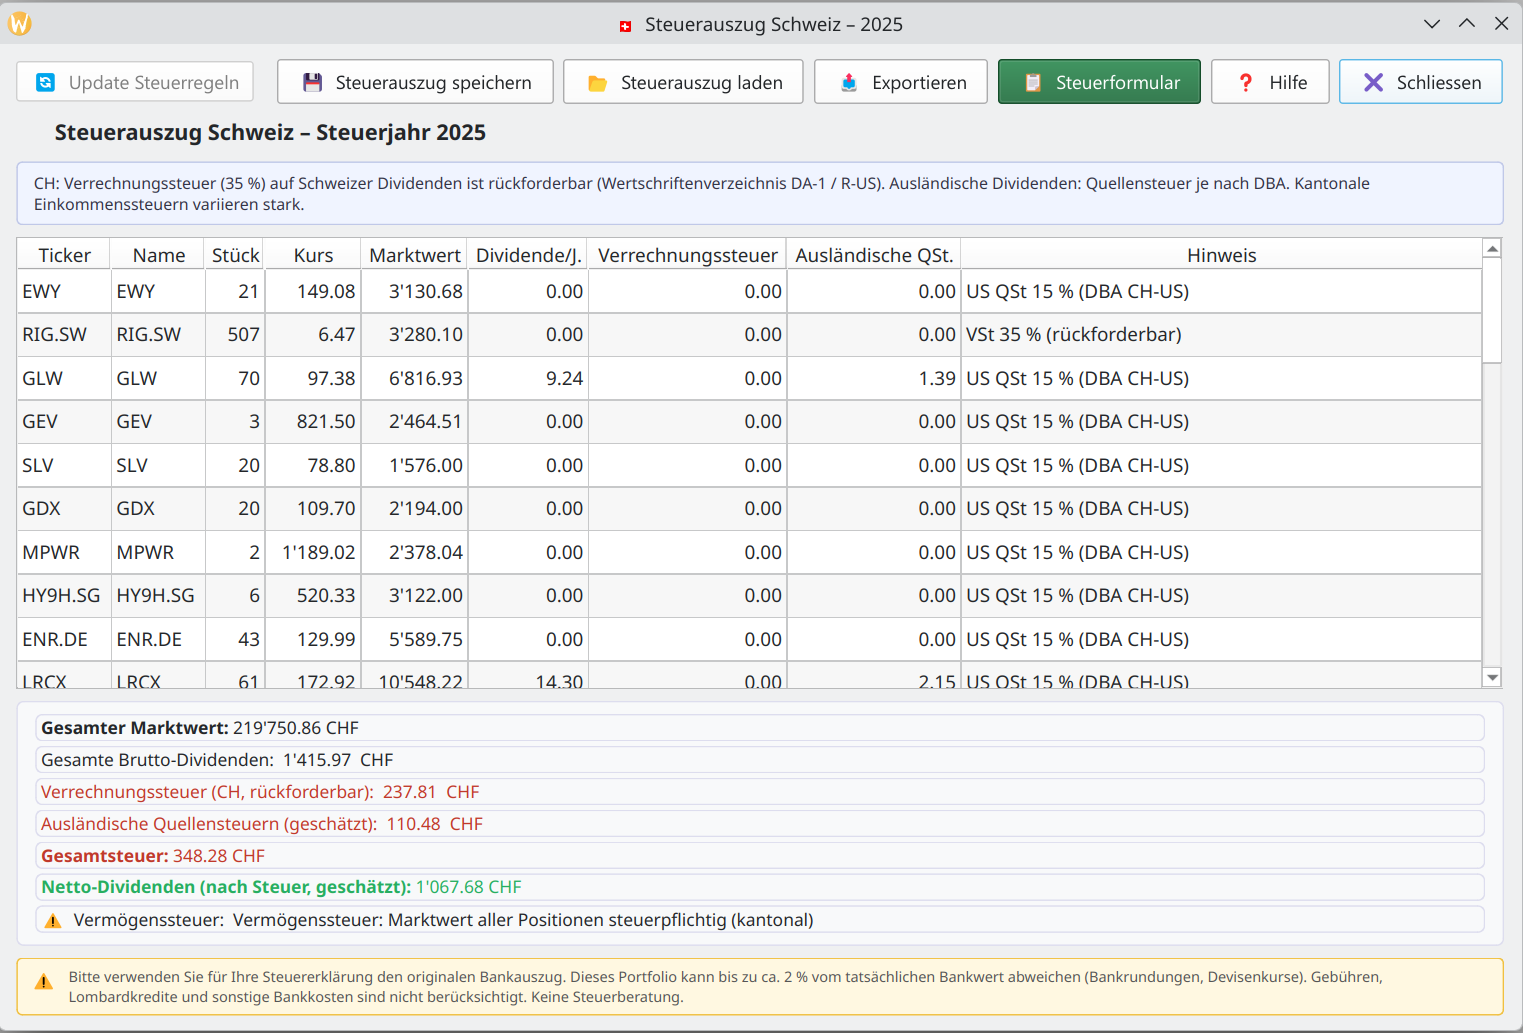
Stock Monitor v5.3.1 ·16 Charts · MA 20/50/200 · Trend · Beta · KI-Analyse · Yahoo Finance · Steuer-Assistent CH/DE/AT/UK/US
Stock Monitor v5.3.1 ·16 Charts · MA 20/50/200 · Trend · Beta · AI Analysis · Yahoo Finance · Tax Assistant CH/DE/AT/UK/US